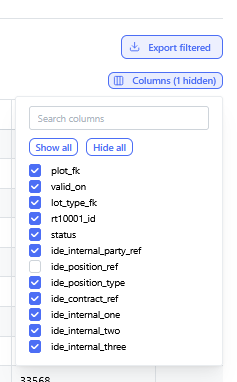
Data Breakdown & Lineage Inspection
Context: cell information page.
To open cells information page click on "!" for the selected cell.
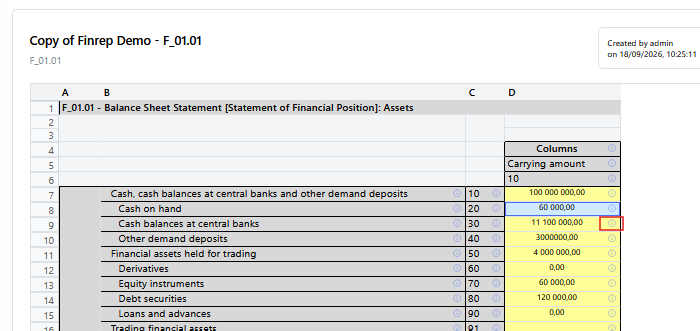
Context: A detailed popup window triggered when inspecting a specific report cell or line item.
-
Key Components & Elements:
-
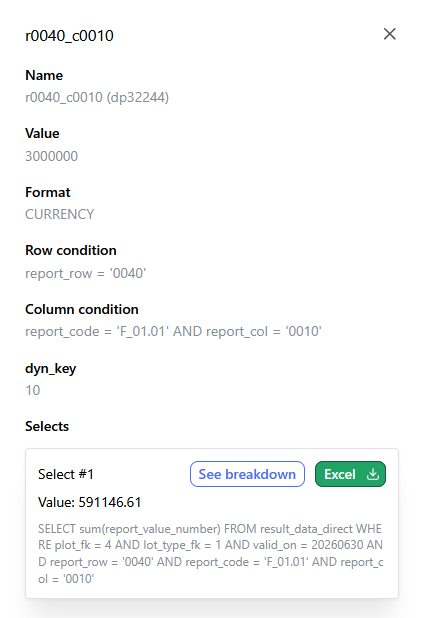
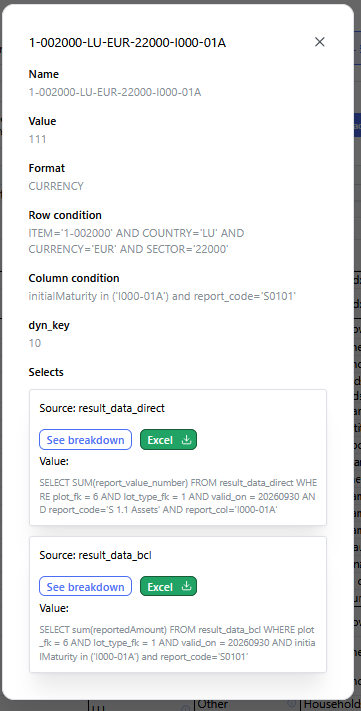
Header Details: Displays key metrics such as cell coordinates/identifiers, calculated numeric values, formatting types, and target row/column conditions.
-
SQL Queries Section: Outlines the underlying database queries executing against system data
tables (specificallyresult_data_directandresult_data_bcl).tables. -
Action Options: Includes action buttons such as "See breakdown" (to inspect underlying record details) and "Export to Excel".
-
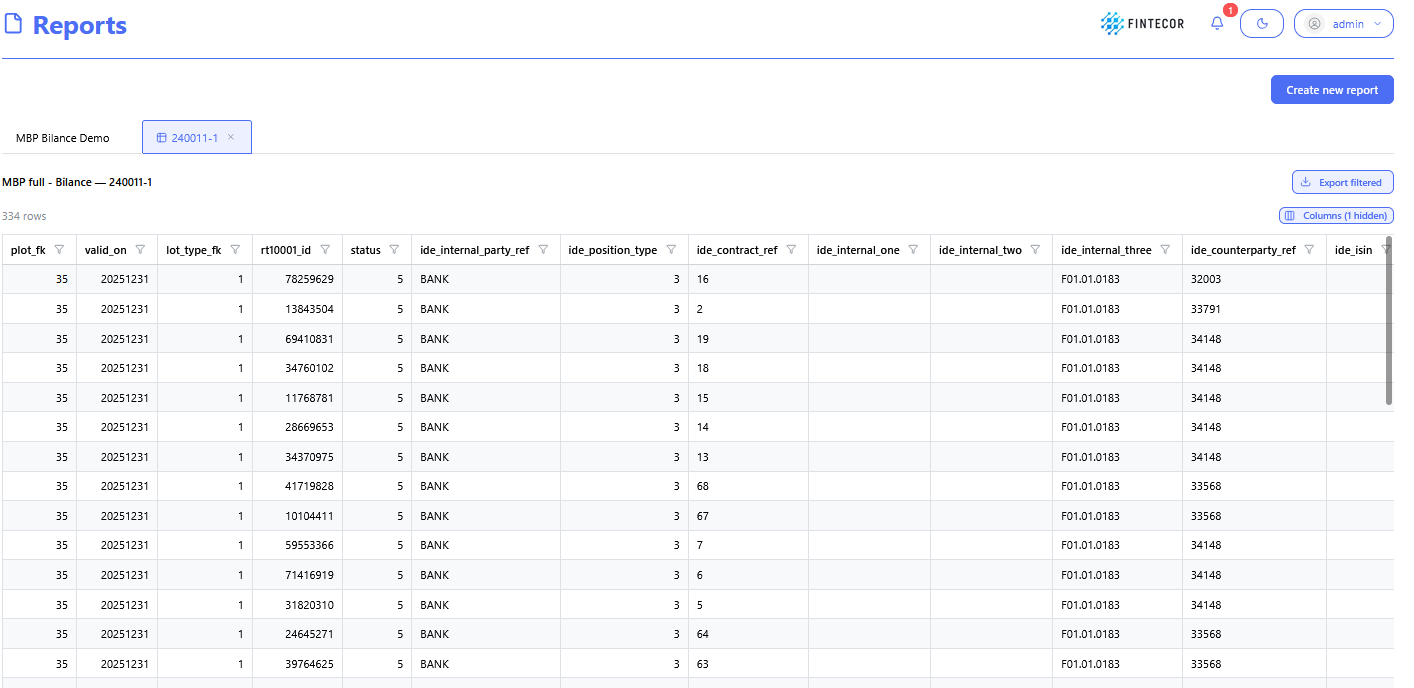
Context: The granular drill-down view displayed after clicking "See breakdown".
-
Key Components & Elements:
-
Data Table/Grid: Shows the individual source records that aggregate into the parent report cell's total value.
-
Columns: Displays source transaction attributes such as record IDs, source system flags, posting dates, amounts, and account codes.
-
Filtering & Pagination Controls: Interfaces for filtering specific line items or sorting source records.
-
Context: A direct inspection view focused on data provenance and lineage flow.
-
Key Components & Elements:
-
Lineage Diagram / Mapping Structure: Visual representation tracing data from raw input tables down to calculated reporting output cells.
-
SQL Preview Panel: Highlights code syntax and condition rules driving cross-table reconciliations.
-